Showing posts with label budget. Show all posts

Thursday, January 22, 2015

Year in Review.....Number Wise, Part III

January 22.  Firstly, a brief comment about the course.  Nothing has changed and after a cursory look I think we are O.K.  My observations noted in the Dec. 18 post are still holding true with no bad ice.  I may hate myself for writing this, but I even think the ice on the new putting greens may be a non-event.  The only bad thing would be above normal temperatures and above 0 overnight lows for a few days combined with rain.  We don't have the snow to ride out one of those.  

..... continued from December 10th......

As well as fairways, mowing the rough is one of the most costly jobs we perform.  In the past, especially last year, we ran both rough units without to much concern for cost.  The bigger unit can mow plenty of rough but it is a hog when it comes to fuel.  Same as we did with the fairways, we made a concerted effort to limit when and how long each unit was operating.  Anytime we can mow without play the better production is.  A few years ago we broke the rough areas down into precise zones and then mapped these zones.  The areas we choose to mow each day are optimized with the hope of avoiding golfers.  On our lunchroom wall we have aerial photographs of the golf course highlighting these zones and operators keep track of where they had been by labeling a zone with a date of when it was last mowed.  You would think it would be easy to decide if an area needed to be mowed or not but there was more than a few times in the past where I would see different operators mowing the same spot a day apart.  All this effort and planning did pay off:
Hours Spent Mowing Rough
Although the decreasing hours trend is obvious, what you don't see is the fact that by operating fewer machines my total staffing requirements also dropped (and this is despite the fact that we added an extra cut around the greens this year.....oops, another caveat: that extra cut was absorbed mostly by me and my hours aren't included in these graphs.   The more I think about that the more I realize that it is wrong and maybe I should start to add my hours spent on equipment to these numbers.  Hmmmm).  In fact, for 2014 from May 1 to Oct.12, the total staffing hours put into maintaining the golf course was 1200 fewer than in 2013 during the same time period.

I already mentioned what a funky year 2014 was with respect to staffing but basically the drop in total hours can be attributed to operating with one less season full time staff member (which actually was part of the plan for 2014).  For 2015 I already know I will be losing another season full time staff member and I plan to replace that person with a part time but I have to believe we are at or slightly below the optimum staff number for my department so I'm not sure how feasible that plan really is.

It's getting repetitive and boring but here is one more graph:

This graph highlights the yearly cost of mowing (labour added to operating costs) for fairways, roughs, and tees and collars.  I don't include the cost of maintaining our equipment in any calculation mostly because there is a fair amount of variability which could slightly skew a comparisons (for example in 2013 we spent just over $500 on repair and maintenance for both fairway units; this year it was only $126.  Same machines and a year older; should be more, you'd think).  I believe I have far less control over the repair costs associated with equipment maintenance.  If I could predict when or how something was going to breakdown I would stop it from happening.  So, I guess, the point being that as inconvenient as it is dealing with old stuff when it comes to mowing the biggest cost is the labour associated with process itself....usually (so much for getting any new stuff?).

Wednesday, December 10, 2014

Year in Review.....Number Wise, Part II

..... continued......

For T & C, a different approach to fertility and different types of fertilizer resulted in a longer time between mowing.  Instead of mowing every 4 days we were able to stretch it to every 6 days which translated into about 40 hours less mowing in 2014 versus previous years.
Hours Spent Mowing Tee's
The only real way, I think, to keep this up is to start spraying with a growth regulator but at KGC's HOC and grass species I would have to take a real hard look to see if there was any savings.

The other area I thought we could do better was the amount of time and money spent mowing fairways.  Different mowing patterns, different fertilizer sources and release patterns, and different growth rates on certain fairways were some the approaches we took when trying to increase efficiencies.
Hours Spent Mowing Fwys
A quiet tee sheet in the very early a.m. and limiting mowing to 4 hrs/day regardless of how long the fairways appeared were the two biggest reasons the total hours spent mowing decreased.  Skipping a fairway because it was a slow grower helped but this is only applicable to some of the back fairways.  I believe the extra time we gained in very early mowing with only 1 group teeing off between 7 and 8 o'clock created less interference between player and equipment which allowed us to keep up with the turf.  The new/used mower we bought this fall is slightly wider but I suspect the increase in fuel costs (bigger engine in this unit) will off-set any gains received by cutting a wider swath.  Really, the biggest decrease in time and money spent on fairways occurred after 2010 when we began to use a single mower on a regular basis.  Looking to the future, I'm having trouble seeing ways to decrease costs associated with mowing fairways.  Shutting off water during the summer is the only thing we could do to see a dramatic change but without tee to green cart paths to control cart traffic it wouldn't take long for more than a few of the fairways to turn to dirt.

To be continued......

Thursday, December 4, 2014

Year in Review.....Number Wise, Part 1

Last year at this time I attempted to explain the time and money each job takes (go HERE) and tried to highlight supposed trends in the maintenance at KGC.  I used that information this past season and with some reading on Twitter and various other sources I tried to implement ways to be more efficient.  The one caveat about this years information is that 2014 was not the best year when it comes to demonstrating staff hours worked this season.  Early season staff changes caused me to veer from my original compulsive, controlling, and over-thought plan but I'll still explain it and then "pontificate" about what I've been able to interpret from the numbers.

As it stands, we are pretty tight staff wise already so what I felt I needed to do was plan each day from opening to closing so I could staff as efficiently as possible .  Generally, it's the SSDD when it comes to the routine maintenance at KGC so I felt I could plan a week out it would be fairly representative of the season in a very general sense.

Schedule for a "Monday"
This was only the first part.  Last winter there was a fair amount of talk amongst turf geeks about something called a "digital job board".  Basically, a digital job board posts staffs daily routines on a template that was stored in the "cloud".  This allowed for viewing jobs anytime and anywhere as well as on the fly changes from a smart phone out on the course.  It was suppose make me more efficient but I didn't take full advantage since my phone lacked a data plan; however, it did make me plan better. For my job board I basically stole the format from the superintendent at Pender Harbour golf course on the coast.  I think it was a Twitter discussion about job boards in which he and allowed anyone to view his job board so I basically copied the look and added some personal touches.
The View as You Enter Lunchroom
Close up of Donated 40" L.E.D T.V.
Now instead of trying to interpret my chicken scratches on the white board staff could easily read what the days plan was.  There was glitches and there is lots of fine tuning to do but I'm fairly confident in saying it has become a useful and appreciated method of communication.

Enough background.   How did all this planning and scheduling affect the operation of my department?  As already mentioned, the whole process made me a better organizer.  It also reaffirmed my assumption that there are very few areas we can cut back on.  Laying out a typical weeks worth of week ahead of time demonstrated to me just how much we are unable to do.  There was more than a few mornings when either a unplanned absence of a staff member or some other event resulted in me having to shuffle a typical daily task or completely eliminate that task.  I had an idea that there were potential cost saving in a few of the daily routine tasks (mowing greens, tee, fairways, roughs, bunkers, daily set-up, rolling greens) associated with maintaining the course.  I thought we could do better (budget wise) when it came to mowing tee's and collars, mowing rough, and mowing fairways.  Maybe we could save money on fuel and labour if we tried a few different things.

To be continued.......

Thursday, November 28, 2013

Hey! Ding-Dong! Read This.


Don't take offense to the title of this post since it is really meant as a message to my future self but feel free to read on.  I've spent the last 4 or 5 work days compiling information and trying to look for trends or ideas that allow me to be more exacting in budgeting.  Although I can go back over ten years with respect to how many hours we spend performing all the maintenance on the the course, I only really began tracking fuel and equipment cost within the last 4 years so any conclusion I arrive at obviously require more than a bit of "extrapolation/interpretation".  That being said there is still some useful info.

Hours spend working on the course (not including me or the mechanic) are entered daily by staff into a spreadsheet.  Of the total hours entered 56% can be attributed to 7 routine tasks: daily set-up of the course, bunkers, mowing fwys, mowing G's, rolling G's, mowing tees and collars, and mowing rough.  In the following chart the big piece of pie represents the seven jobs while the rest of the pieces show how the remaining 44% of the staffs time is divided up.


 All the goofy little labels in the legend at the bottom of the chart are some of the job categories staff use when assigning hours they work.  When I am trying to glean information, any information, I focus on the categories that make up the large piece of the pie.  Here's what I've learned:
  • Fairways:  We have 2 machines and in 2010 we ran both about 46% of the time and one machine 54%.  On average, staff spent 5 hours/day mowing. In 2013 we ran 2 machines 27% of the time and one machine 63% and spent 4.5 hours/day mowing.  The obvious trend here is less mowing which translates into less money spend on staffing and fuel (with less operating time it should mean less repairs but that's not necessarily true because of the mowers age) 
  • Tees and Collars:  In 2010 staff spent an average of 4.43 hours per day mowing T&C for a total of 237 hours.  In 2013 it took an average of 2.95 hours per day for a total of 192 hours over the entire season.  Again, a declining trend.  Instead of mowing both tees and collars 3 days a week we only mow collars 3 times and tees 2 times which saved slightly on both fuel and staffing
  • Rough:  In 2010 the average hours per day spent mowing rough was 5.43 while in 2013 the average was 3.98.  Unfortunately, a slight labour savings (and maybe repair costs) was offset by the increased fuel costs (we used the bigger machine more this year and it cost more to run) and the fact we mowed rough 20 more days in 2013 than 2010.  The more days mowed relates to the amount of grass this year and also to the extra cut we brought in this year to lower the rough around the greens.  Although the trend was for less hours mowing per day the cost of rough mowing actually is on the rise.
  • Greens Rolling:  Greens were rolled 50% more this year than in past years.  In general, with respect to the greens we did nothing different compared to last year but there were fewer speed complaints so from an anecdotal stand point rolling may have had a benefit on playing conditions.  Obviously, the trend here is increasing in labour, fuel, and maintenance.
  • Greens: Not much change here over the past 4 years with a slight increase in costs due to labour.  Long ago we began making use of the triplex as a cost savings measure with the greens being mowed about 50% of the time with triplex and 50% with walkers.  In the future the only savings here would be to go to 100% triplex.  However, we would have to take a close look since we only have one triplex mower and going that route would require purchasing a second mower.  That initial capital cost may take some time to be offset by labour savings.
  • Bunkers: The total hours spent raking bunkers in 2010 was 902 and on average staff spent 2.5 hours/day raking all the bunkers.  We use to hand rake with 3 people and 25% of the time 1 guy would just touch up bunkers.  In 2013 we still hand rake and spend 2.3 hours per day for a total of 519 hours but now 67% of the time one guy does all the raking.  For the past couple years now we've only hand raked half the bunkers each day and touched up the rest.  Bunkers are expensive and aside from free labour or completely eliminating the bunkers I don't see any practical way to save more money.
  • Daily Set Up: This is another job that has seen only a slight increase in cost and most of that is labour related.  The importance of this job is to not only create variety in how the course plays but also to distribute wear which is extremely important.  This is another job where I don't see any practical way to save money.
Who cares how long each job takes and how much it costs?  Mostly me, I guess, but as things remain competitive in the golf market we are going to have to keep trying different ways of doing things.  I think its a Jimmy Pattison quote that says something like there isn't a business that can't find a 3 to 5% efficiency (or something like that) but, and I mentioned this during the September Special Meeting, I am starting to think that the efficiencies are getting harder to find and any we are able to exploit may yield less than desirable results.

Wednesday, February 13, 2013

Number Crunching - Hours Worked

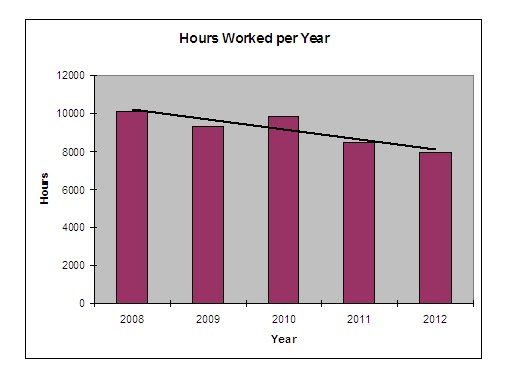
During the winter season I spend a bit of time reviewing and planning.  In the following weeks I'll post small snippets about some things you may be interested in knowing. This week I'll post about the hours my staff works.  The following chart shows the total hours worked on the golf course since 2008 up until 2012 (the time frame is from April 1st to October 15th since this is typically the time when most hourly staff are employed): 

The trend is obvious with the take home message being we spending less time maintaining the course; about 2200 hours less since 2008.  The blip in 2010 is for two reasons:
  1. This was the spring we did the cart path paving
  2. This was also the year we had problems on #1 Green 
How do these hours relate to staffing numbers? Total staff maintaining the course (not including myself and the mechanic) was
  • 2008: 17
  • 2009: 17
  • 2010: 17
  • 2011: 16
  • 2012: 14
Except for 2012 the staffing numbers are fairly similar.  But a closer look explains why the total hours spent working on the course are dropping.  In 2008 there was an assistant,  8 seasonal F/T, 4 seasonal P/T, and 4 students on staff for a total of 17.  In 2011 there was an assistant, 4 seasonal F/T, 8 seasonal P/T, and 3 P/T students also for a total of 17.  The biggest drive for the change in the staffing make-up was increasing wage costs.  A graph showing total wages from 2008 to 2011 would show a slight increasing trend over those years.  I guess the good news is 2012 reversed this trend with a decrease in wages of around 11%.  For the 2012 season two part time staff were bumped up to seasonal F/T and another seasonal F/T was hired (the increase in seasonal F/T staff was because we ran without an assistant superintendent this past season; an unfortunate trend for the foreseeable future) so the staff make up was 7 seasonal F/T, 5 seasonal P/T and 2 P/T students for total of 14.  It's not just the amount of staff that explains the declining hours.  Start and ending dates have also changed for some hourly staff.  They now start later and finish sooner in the season.

Lots of information manipulated in an effort to show the connection between the maintenance levels and available resources (people and time in this example) over the past few years.  Without the bodies and with less time the level of maintenance has to change; furthermore, the competitiveness of the market we're in makes change all the more important to keep us in operation.  I'll be interested to hear how other people interpret this information.