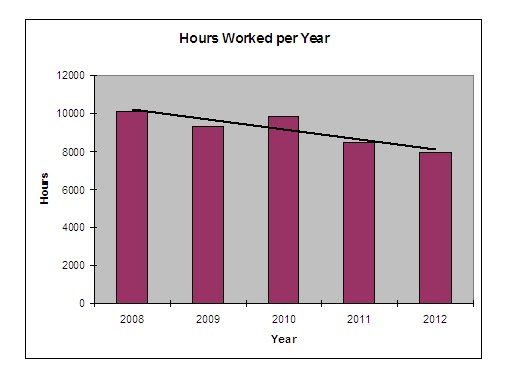
During the winter season I spend a bit of time reviewing and planning. In the following weeks I'll post small snippets about some things you may be interested in knowing. This week I'll post about the hours my staff works. The following chart shows the total hours worked on the golf course since 2008 up until 2012 (the time frame is from April 1st to October 15th since this is typically the time when most hourly staff are employed):
The trend is obvious with the take home message being we spending less time maintaining the course; about 2200 hours less since 2008. The blip in 2010 is for two reasons:
- This was the spring we did the cart path paving
- This was also the year we had problems on #1 Green
How do these hours relate to staffing numbers? Total staff maintaining the course (not including myself and the mechanic) was
- 2008: 17
- 2009: 17
- 2010: 17
- 2011: 16
- 2012: 14
Except for 2012 the staffing numbers are fairly similar. But a closer look explains why the total hours spent working on the course are dropping. In 2008 there was an assistant, 8 seasonal F/T, 4 seasonal P/T, and 4 students on staff for a total of 17. In 2011 there was an assistant,
4 seasonal F/T,
8 seasonal P/T, and 3 P/T students also for a total of 17. The biggest drive for the change in the staffing make-up was increasing wage costs. A graph showing total wages from 2008 to 2011 would show a slight increasing trend over those years. I guess the good news is 2012 reversed this trend with a
decrease in wages of around 11%. For the 2012 season two part time staff were bumped up to seasonal F/T and another seasonal F/T was hired (the increase in seasonal F/T staff was because we ran without an assistant superintendent this past season; an unfortunate trend for the foreseeable future) so the staff make up was 7 seasonal F/T, 5 seasonal P/T and 2 P/T students for total of 14. It's not just the amount of staff that explains the declining hours. Start and ending dates have also changed for some hourly staff. They now start later and finish sooner in the season.
Lots of information manipulated in an effort to show the connection
between the maintenance levels and available resources (people and time
in this example) over the past few years. Without the bodies and with less time the level of maintenance has to change; furthermore, the competitiveness of the market we're in makes change all the more important to keep us in operation. I'll be interested to hear how other people interpret this information.